
AWS Cloud Monitoring Services
AWS provides a comprehensive suite of monitoring and observability services that help you track the health, performance, and availability of your applications and infrastructure. These services enable you to collect data, visualize metrics, log events, trace requests, and respond to operational issues.
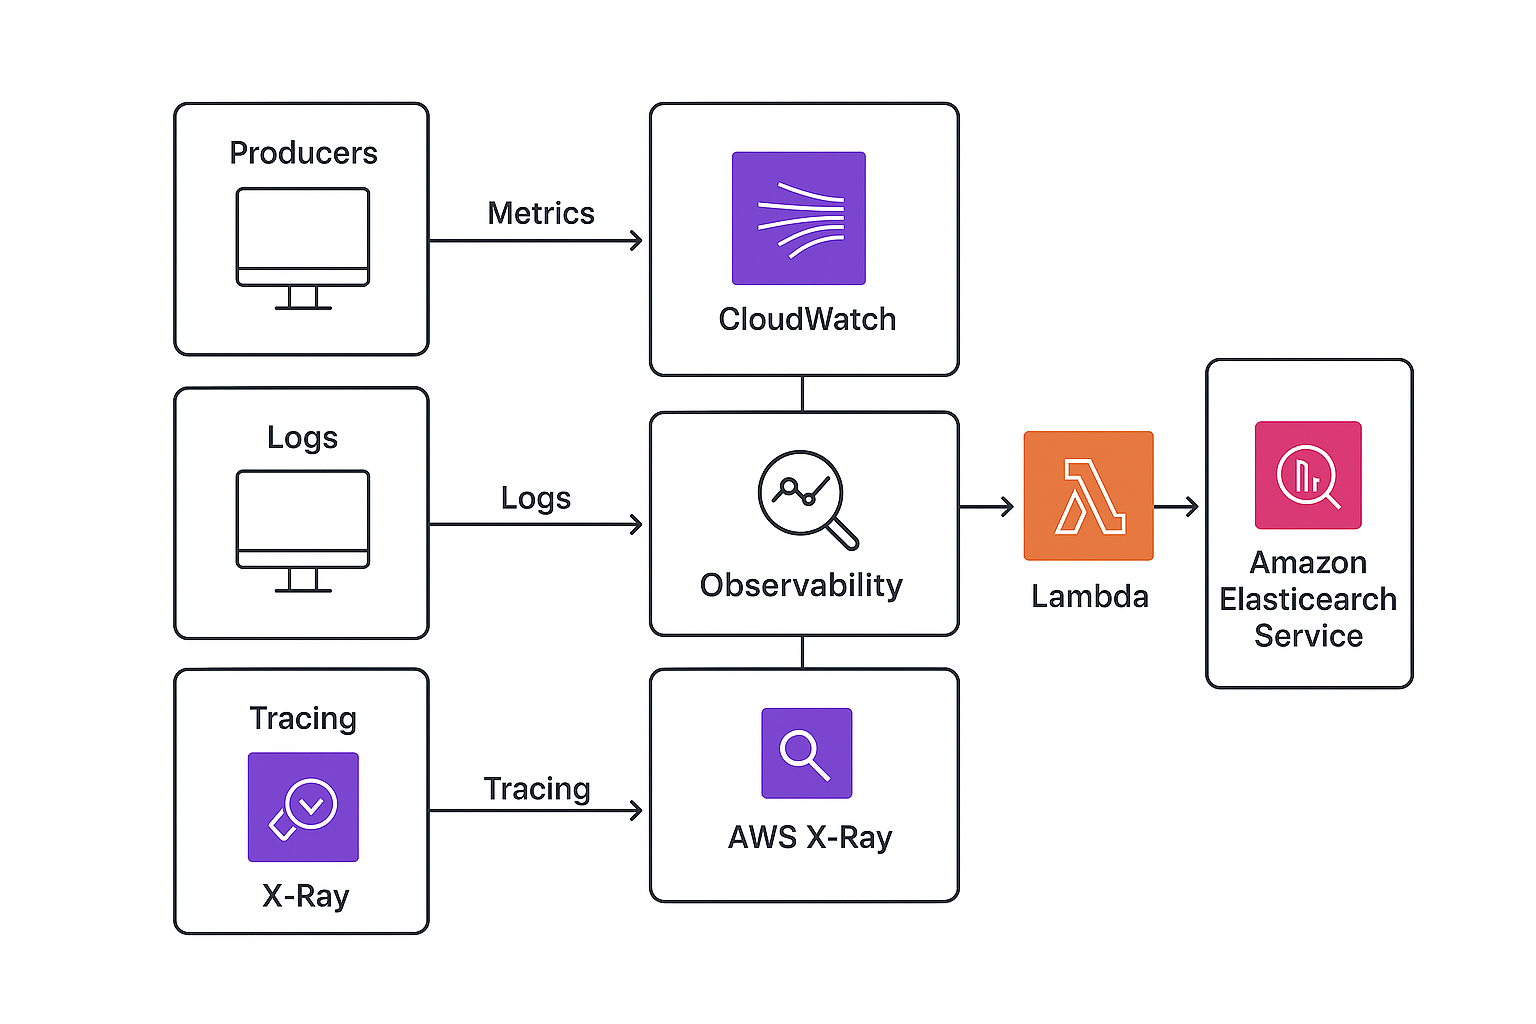
1. Amazon CloudWatch
- Description: The foundational monitoring service for AWS resources and applications. It collects and tracks metrics, collects and monitors log files, and sets alarms.
- Key Features:
- Metrics: Collects metrics from AWS services (EC2, Lambda, S3, etc.) and custom application metrics.
- Logs: Centralized logging for applications, AWS services (VPC Flow Logs, CloudTrail), and custom logs.
- Alarms: Trigger actions (SNS notifications, Auto Scaling, EC2 actions) based on metric thresholds.
- Dashboards: Customizable dashboards to visualize metrics and logs.
- Events (EventBridge): Routes events from AWS services, SaaS applications, and custom applications to targets.
- Synthetics (Canaries): Monitor endpoints and APIs from outside your network.
- RUM (Real User Monitoring): Collects client-side data for web applications.
- Use Cases: Performance monitoring, resource utilization tracking, application logging, anomaly detection, automated responses to operational events.
2. AWS CloudTrail
- Description: Records AWS API calls and related events made by an account, including actions taken through the AWS Management Console, AWS SDKs, command line tools, and other AWS services.
- Key Features:
- Event History: Provides a record of account activity.
- Trails: Delivers log files to an S3 bucket for long-term storage and analysis.
- Event Selectors: Filter which events are logged.
- Integrations: Integrates with CloudWatch Logs for real-time monitoring and EventBridge for event-driven automation.
- Use Cases: Security analysis, compliance auditing, resource change tracking, operational troubleshooting.
3. Amazon X-Ray
- Description: Helps developers analyze and debug distributed applications, such as those built using microservices architectures. It provides an end-to-end view of requests as they travel through your application.
- Key Features:
- Service Map: Visual representation of application components and their connections.
- Trace Data: Collects data about requests, including latency, HTTP method, and response.
- Annotations & Metadata: Add custom information to traces.
- Sampling: Control which requests are traced to manage costs.
- Use Cases: Performance analysis, root cause analysis of errors, identifying bottlenecks in distributed systems, microservices debugging.
4. AWS Config
- Description: Provides a detailed inventory of your AWS resources, their configurations, and how they change over time. It also allows you to assess, audit, and evaluate the configurations of your AWS resources.
- Key Features:
- Resource Inventory: Discovers and tracks AWS resources.
- Configuration History: Records changes to resource configurations.
- Config Rules: Evaluate resource configurations against desired settings (compliance checks).
- Remediation Actions: Automatically fix non-compliant resources.
- Use Cases: Compliance auditing, security posture management, operational troubleshooting, change management.
5. Amazon Managed Service for Prometheus (AMP)
- Description: A fully managed, highly available, and secure monitoring service that makes it easy to monitor containerized applications at scale using the Prometheus monitoring system.
- Key Features:
- Prometheus Compatibility: Works with Prometheus query language (PromQL) and client libraries.
- Scalability: Automatically scales to handle large volumes of metrics.
- High Availability: Stores metrics durably across multiple Availability Zones.
- Integrations: Integrates with Amazon EKS, ECS, and Grafana.
- Use Cases: Monitoring Kubernetes/containerized workloads, microservices performance, custom application metrics with Prometheus.
6. Amazon Managed Grafana (AMG)
- Description: A fully managed service for Grafana, an open-source analytics and visualization web application. It allows you to query, visualize, alert on, and explore metrics, logs, and traces from various data sources.
- Key Features:
- Managed Grafana: No need to set up or maintain Grafana servers.
- Data Source Integrations: Connects to CloudWatch, AMP, X-Ray, S3, and many other data sources.
- Dashboards & Visualizations: Create rich, interactive dashboards.
- Alerting: Configure alerts based on data from various sources.
- Use Cases: Centralized observability dashboards, cross-service data visualization, operational intelligence.
7. AWS Health Dashboard
- Description: Provides personalized view of the health of AWS services and resources, showing ongoing and upcoming events that might affect your applications.
- Key Features:
- Personalized View: Shows only relevant events for your account.
- Event Details: Provides information about service issues, scheduled changes, and security notifications.
- Notifications: Integrates with EventBridge and SNS for proactive alerts.
- Use Cases: Proactive awareness of AWS service issues, planning for scheduled maintenance, understanding impact of AWS events.
8. Amazon Detective
- Description: Automatically collects log data from your AWS resources and uses machine learning, statistical analysis, and graph theory to build a linked set of data that enables you to conduct faster and more efficient security investigations.
- Key Features:
- Automated Data Ingestion: Collects data from VPC Flow Logs, CloudTrail, GuardDuty.
- Interactive Visualizations: Helps analyze security findings.
- Behavior Graphs: Builds a unified view of resource behavior.
- Use Cases: Security incident response, threat hunting, root cause analysis of security findings.
9. Amazon GuardDuty
- Description: A threat detection service that continuously monitors your AWS accounts and workloads for malicious activity and unauthorized behavior.
- Key Features:
- Intelligent Threat Detection: Uses machine learning, anomaly detection, and integrated threat intelligence.
- Continuous Monitoring: Monitors VPC Flow Logs, CloudTrail event logs, and DNS logs.
- Findings: Generates detailed security findings.
- Use Cases: Proactive threat detection, identifying compromised instances, detecting unauthorized access.
Monitoring Best Practices
- Centralized Logging: Aggregate logs from all sources into CloudWatch Logs or S3.
- Comprehensive Metrics: Collect both infrastructure and application-level metrics.
- Proactive Alerting: Set up alarms for critical metrics and events.
- Distributed Tracing: Use X-Ray for microservices to understand request flow and latency.
- Configuration Management: Use AWS Config to track resource changes and ensure compliance.
- Security Monitoring: Leverage CloudTrail, GuardDuty, and Detective for security posture.
- Dashboards: Create unified dashboards (CloudWatch, Grafana) for operational visibility.
- Automated Remediation: Use CloudWatch Alarms/Events with Lambda/SSM to automate responses.